In recent years, much has been said about adapting solder paste printing, placement and inspection processes to the new challenges posed by the advancing miniaturization of SMD components. During this time, there has also been an increase in the frequency at which components are blown away during convection soldering of electronic PCBs. In particular, the SOD323 design (small outline diode) is frequently affected by this problem. The mechanisms that lead to this defect, their interactions and possible remedies are explained in this article on the basis of CFD simulations (computational fluid dynamics), analytical models and experiments.
Fundamentals of heat transfer
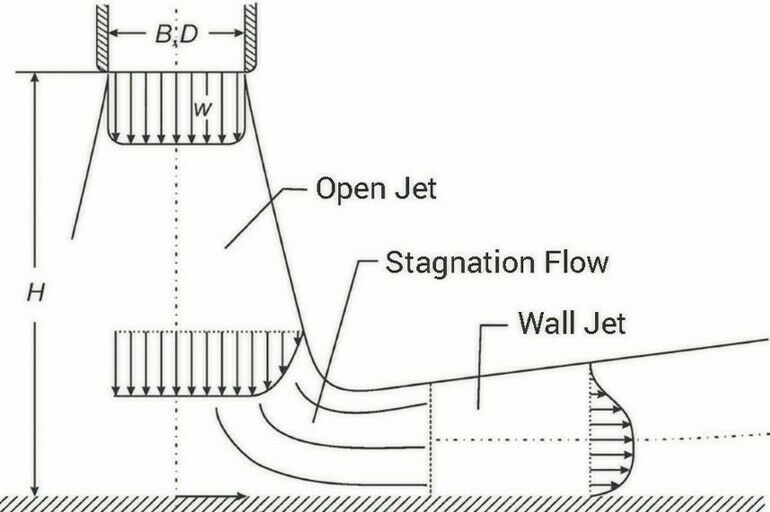
In convection soldering systems, heat transfer is based on the principle of forced convection. Ambient air or nitrogen is used as the heat transfer medium. After the medium has been heated up it is directed, for example, through a nozzle array onto a PCB and heat transfer takes place. Heat transfer depends on the temperatures of the PCB and the medium, and on the heat transfer coefficient. Jet streams from a nozzle array which strike a product beneath it are very often used in thermal systems for cooling, heating or drying. The image above shows the flow field of a jet stream striking a surface along with its typical open jet, stagnation flow and wall jet zones.
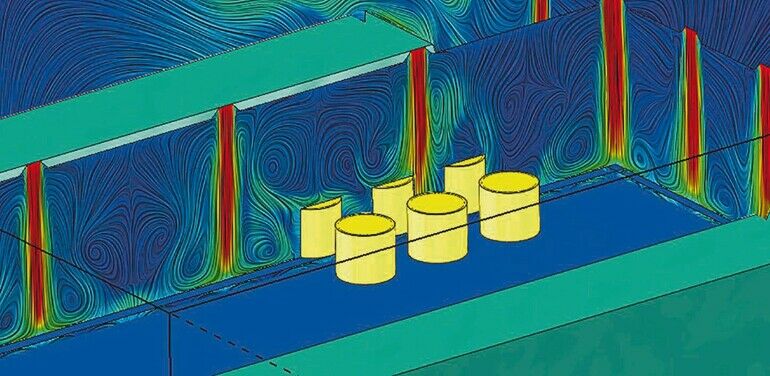
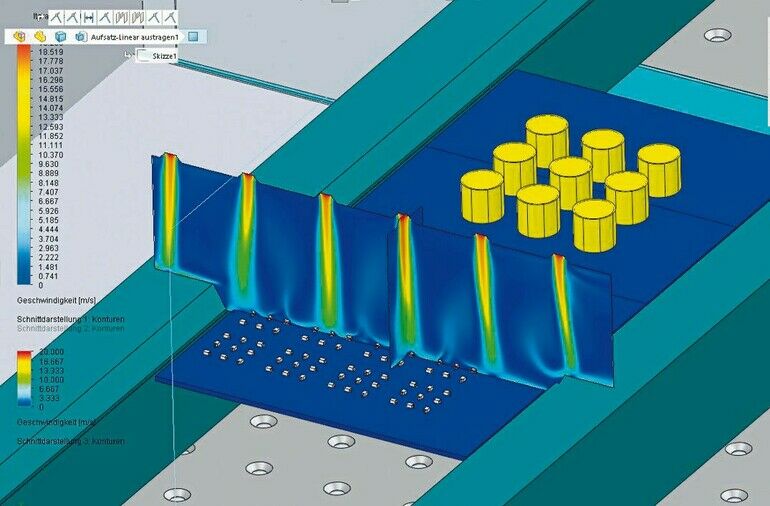
The heat transfer coefficient depends on the geometry of the nozzle, its distance from the impact surface, temperature difference and flow velocity. See the image overleaf for an example of simulated velocity distribution for an arrangement consisting of nozzle array and PCB with electrolytic capacitors. The flow zones described above are visualized here by means of flow lines. Maximum heat transfer occurs at the end of the open jet at the point of flow stagnation [Schabel & Martin, ‘Wärmeübertragung bei erzwungener Konvektion: Prallströmungen’, 2019].
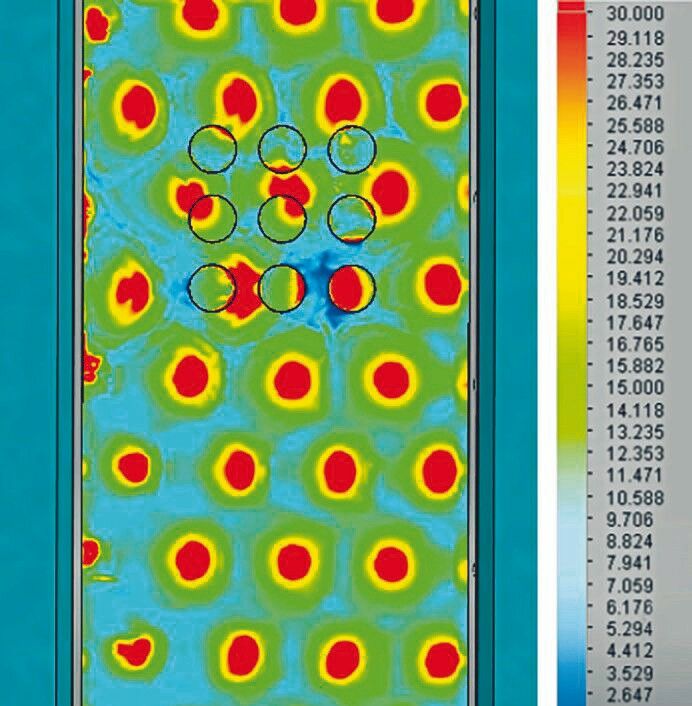
Next to this is an example of simulated distribution of the heat transfer coefficient for an arrangement of several nozzles and a PCB with electrolytic capacitors. This visualization represents only a momentary snapshot from a transient calculation. In the actual process, the PCB moves so that it’s alternately subjected to lower and higher heat transfer coefficients in the direction of transport.
When designing the nozzle arrays, particular attention is focused on longitudinal and transverse profile requirements and the difference in temperature between small and large thermal masses. Optimum heat transfer and lowest possible wind forces are required as well, which interact with each other in a contrary manner. Nozzle arrays are static system components and they have to perform well with a broad range of PCBs and components. Borderline cases also exist, especially at high frequencies or fan power levels, as is the case for SOD323 components.
Experimental investigations: flow velocity measurements
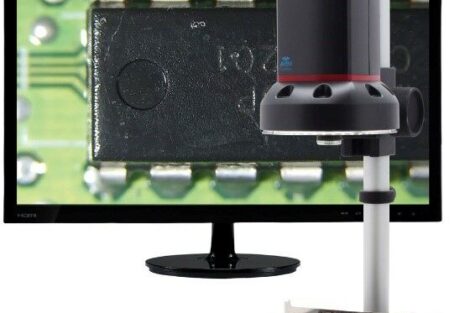
During the first step of the investigation, wind forces to which the respective component is subjected relative to fan power need to be determined experimentally. Whereas temperature measurement in an oven belongs to the state of the art and a variety of profilers etc. are available for this purpose, the measurement of flow velocities in the vicinity of the PCB poses a challenge. In particular, this is due to very high process temperatures and complicated flow conditions. As part of an internal research project, a measuring system was developed at Rehm Thermal Systems on the basis of a vane anemometer, which is capable of recording flow in all 3 spatial directions, as well as directional changes, at typical soldering temperatures.
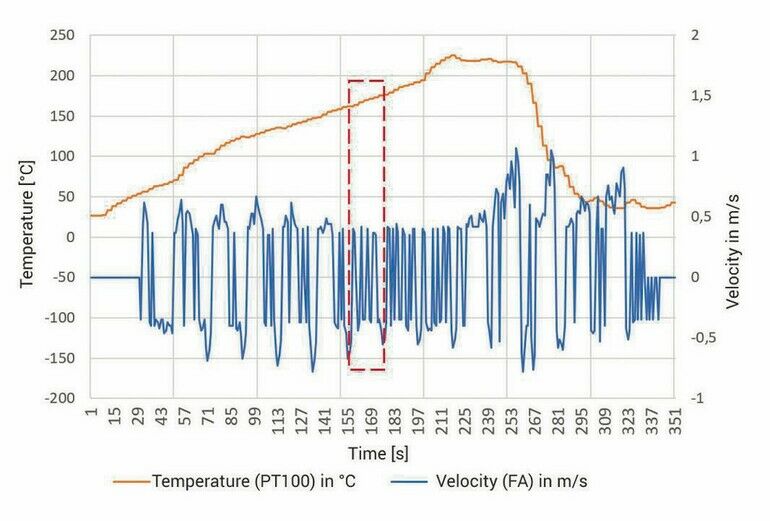
The graph on the previous page shows the results of a series of measurements performed with this system. The flow velocity curve shows a number of direction reversals in proximity to the nozzle arrays. This is due to the paths of the individual nozzle jet streams: if the vane wheel is moving towards a jet stream, it rotates in one direction. After passing the stagnation point, flow is reversed. This explanation also correlates with the temperature curve, which shows small temperature fluctuations when passing individual nozzles (red marking). Velocities lie within a range of ± 0.75 m/s. Due to the size of the vane wheel (approximately 15 mm), measurement results tend to have a coarse resolution and can’t be extrapolated to significantly smaller components.
Experimental investigations: Blow-off test
In order to investigate the influence of flow and temperature on SOD323 components being blown away, testing was conducted with the settings listed in the table. In each case, fan power at which the components were blown away was determined. Tests conducted at 23°C and 180°C served the purpose of determining the influence of temperature on the properties of the solder paste.
Displacement or rotation of components near the pads was most frequently observed without solder paste (1) and with solder paste at 180°C (3). This is due to the geometry of the component: the connections can be no more than 0.05 mm longer than the height of the component, so that the component nearly rests on the PCB. For this reason, it’s assumed that the printed solder paste is stressed to the point of shearing when subjected to wind.
Many components outside the pad area had been knocked over. This is due to unevenness (conductor paths etc.) on the circuit board, against which the connections come into contact, causing the component to tip over. The components blown off of the PCB were located exclusively in zone 2. No components were blown off with standard temperature and the fan set at 73% power.
Numerical investigations: Model description
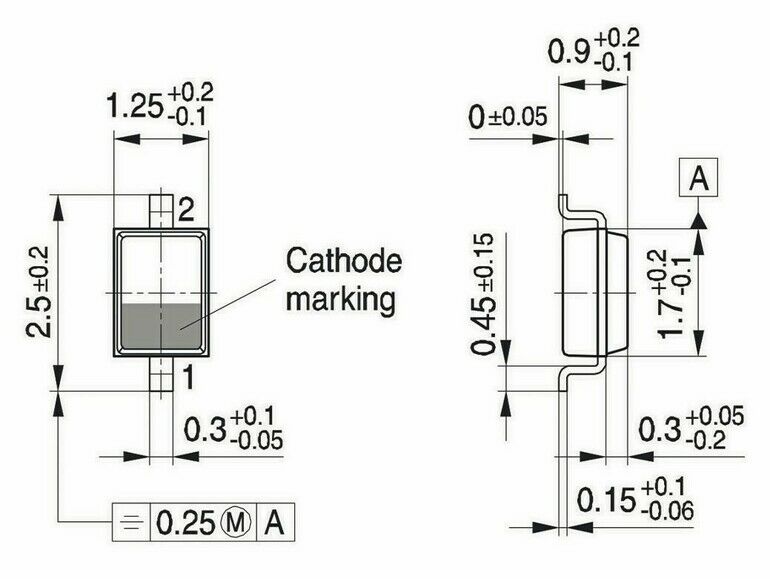
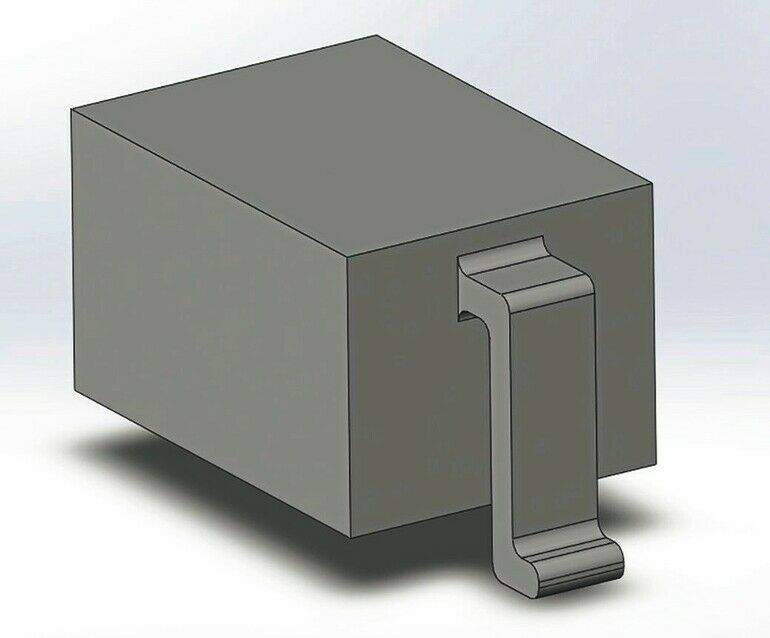
Simulations for determining flow velocities were carried out concurrent to the experimental investigations. The Solidworks Flow Simulation tool was used for this purpose. The diagram on the left shows the dimensions of an SOD323 taken from a data sheet, as well as the geometry derived therefrom.
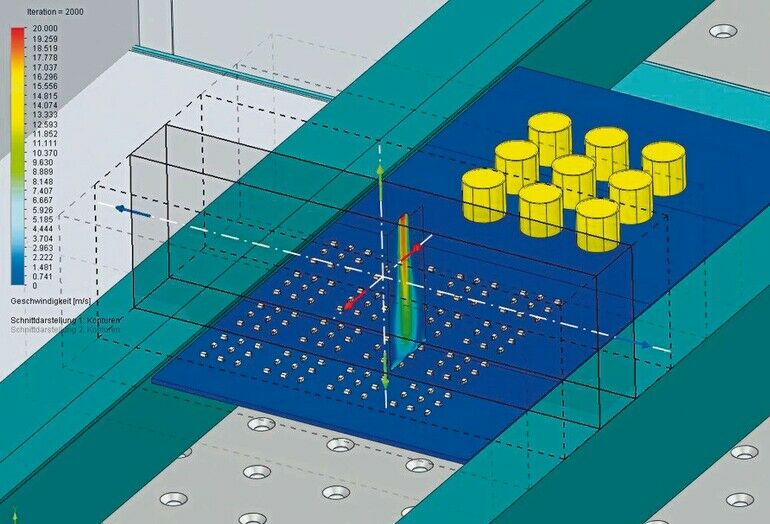
In the simulation model, the components are firmly connected to the PCB. In order to take the influence of orientation into account, the components are aligned in the direction of transport, as well as transversely. Loads to which the PCB is subjected are determined in the stationary state, i.e. without moving the PCB through the oven. The left-hand image at the bottom of the previous page shows the calculation space with periodic boundary condition. Ambient pressure was defined as an external boundary condition. The blowing force of a total of 6 gas jets is simulated, which act on 36 components with orientation parallel and at a right angle to the direction of transport (see the image on the right).
This static arrangement of components and boundary conditions is intended to approximate the forces acting on a moving PCB. Spatial directions are defined as follows: X – in transport direction, negative, Y – vertically upward, positive, Z – at a right angle to the direction of transport, positive, to the left. Flow velocities and resulting forces were simulated for experimentally determined fan powers of 100%, 91%, and 45%.
Simulation results
As the second part of this paper will detail, the results of the simulation demonstrated that the maximum forces act upon different components and that there is no component for which a force resulting from all three directions of action must be considered the greatest force.
To be continued…
The second part of this white paper, set to be published in our October 2023 issue, will evaluate the results of the simulations for determining flow velocities, discuss the role of solder paste, and summarise the results of the investigation overall.


