

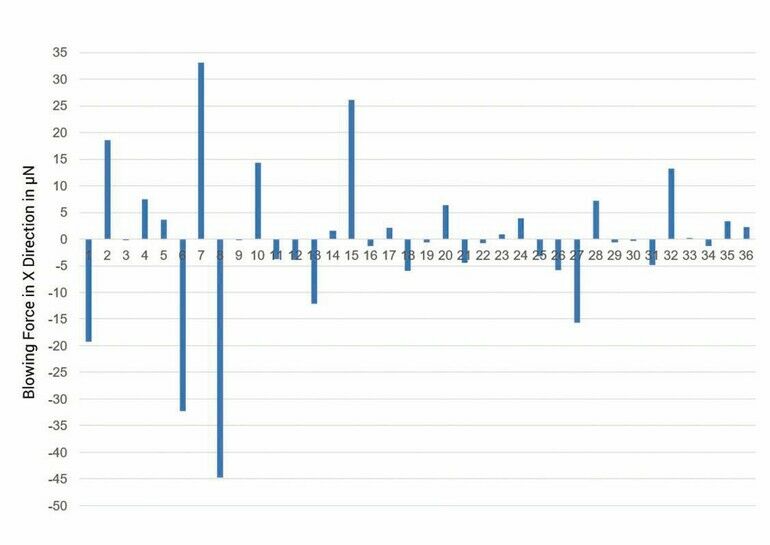
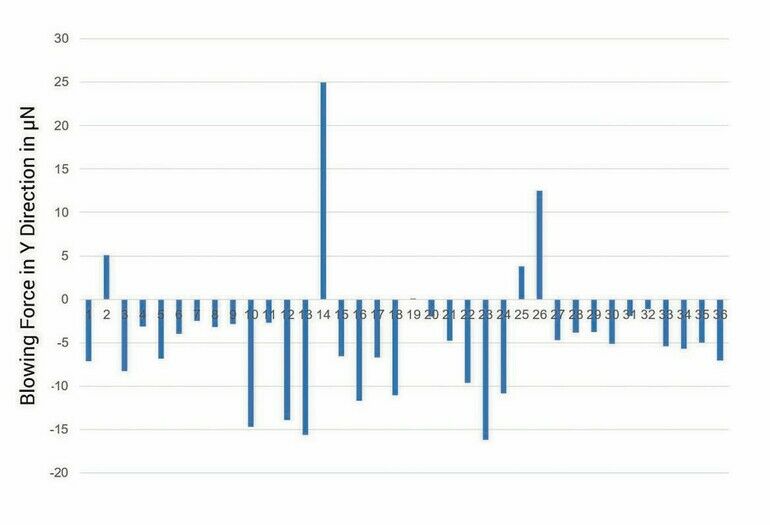
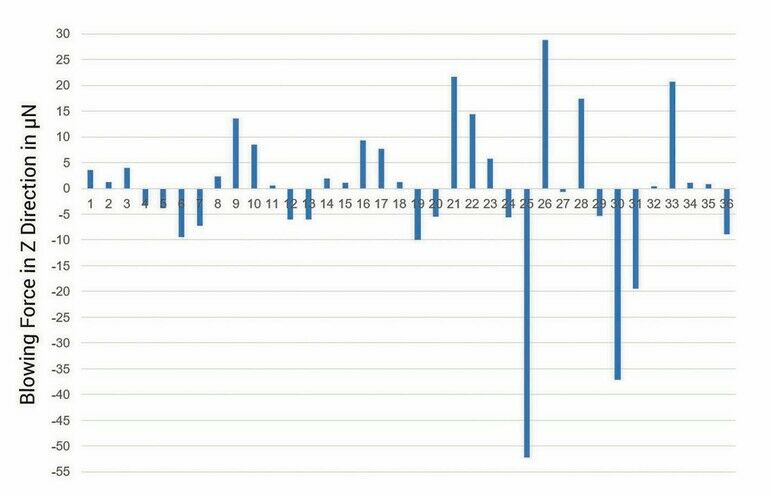
The simulation results demonstrate that the maximum forces act upon different components and that there is no component for which a force resulting from all three directions of action must be taken into account as the greatest force.
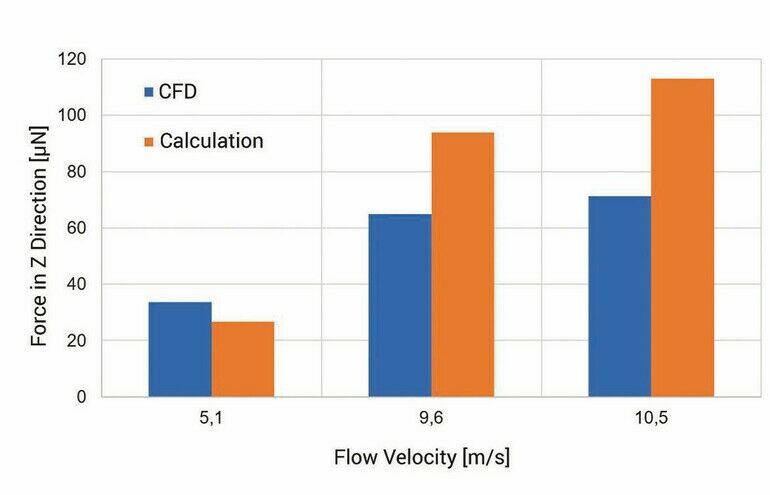
As the graphs opposite show, the maximum force in the X direction acts upon the smaller side surface of component 8. This force amounts to 45 µN. The maximum force in the Y direction (buoyancy force) acts upon the upper side of component 14 and amounts to 25 µN. The maximum force in the Z direction (graph on page 40) acts upon the larger side surface of component 25 and amounts to 52 µN. As the forces in the X and Z directions act upon component side surfaces of equal size, only the force in the Z direction will be regarded as the blowing force in the following, and the force in the Y direction will be regarded as the buoyancy force. The table below summarizes simulation results for the Y and Z directions. If flow velocity can be measured or determined numerically as described above, the force acting upon an object as a result of such flow can be calculated using the equation: FW=cW 1/2 pv2A
The case in hand involves a rectangular body with a flow circulating around it. With a body of this type, resistance coefficient cW comprises 100% of the form resistance of the body and amounts to 1.1 [J. Zeitler & G. Simon, Physik für Techniker, 2016]. Forces in the Z-direction can be calculated using density of air p (1.225kg/m³), the largest side surface area A of the component (1.53 x 10⁻⁶m²) and velocity values shown in the table below.
Comparison of the forces reveals that, especially for higher velocities, the results of the two methods differ greatly. This can be attributed to finer flow state resolutions achieved with the CFD method, including detachment phenomena and so on.
Calculation & comparison of forces
The holding forces for the three cases are calculated and compared with those numerically ascertained.
1. Without solder paste at 45% fan power
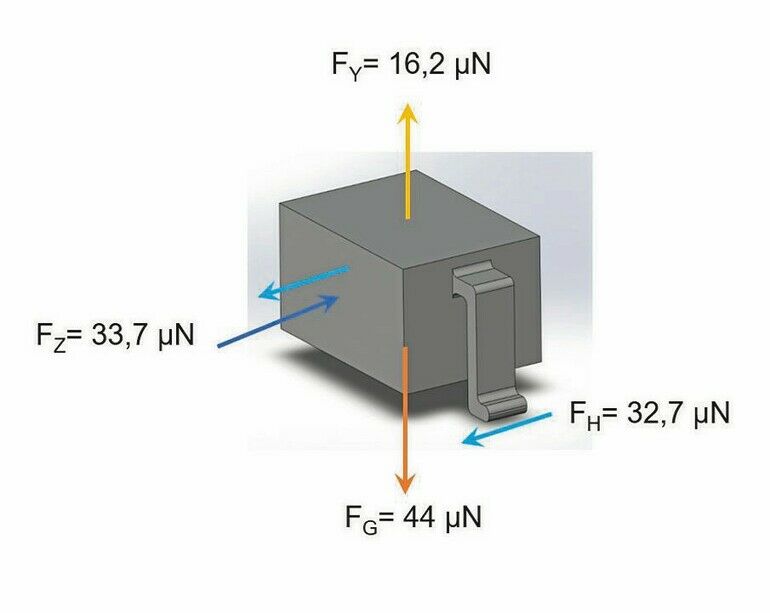
In the Y direction
In accordance with the formula: FG=mg
with a component mass m of 0.0045g and gravitational acceleration of 9.81m/s², force due to weight amounts to 44 µN. This is greater than the buoyancy force of 16.2 µN, so the component cannot be raised.
In the Z direction
Without solder paste and according to the equation: FH=μmg
static frictional force is 32.7 µN assuming a static friction coefficient µ of 0.74 for tin on tin [P. J. Blau, Friction Science and Technology: From Concepts to Applications, 2008]. Static frictional force is smaller than the determined lateral wind force of 33.7 µN, and thus the component is blown away.
2. With solder paste at 100% fan power and 23°C Solder paste rheology
Solder paste has to meet a broad range of requirements for the production of electronic PCBs. The solder paste’s flux has to demonstrate specific properties for each process step. Solder pastes can be classified as non-Newtonian and thixotropic fluids. Viscosity, and thus any response to a force, is dependent on the shear rate for this reason.
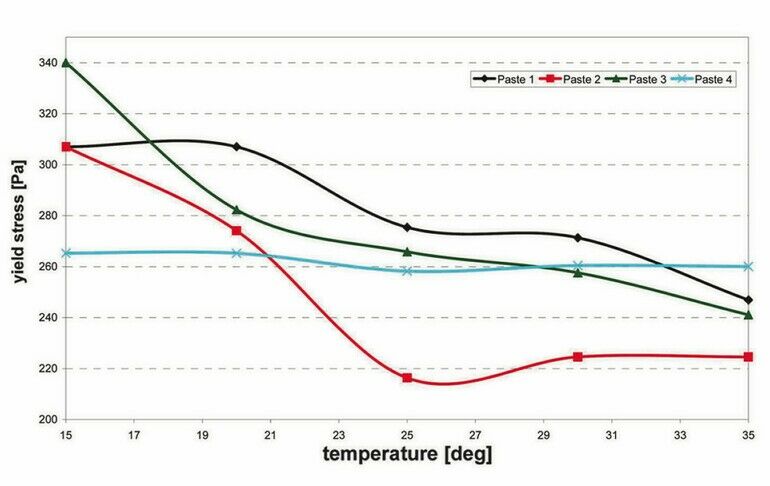
In solder paste, stress is converted by means of shear into an elastic strain component and a plastic deformation component. After stressing has ended, the elastic strain component causes the solder paste to relax. The transition from the elastic to a plastic strain component is called the yield point [G. Diepstraten & D. Wu, ‘Estimating Stencil Life and Ideal Heating Profile of Solder Paste Using Advanced Thermo-Gravimetric Analysis’]. The yield point is temperature-dependent and should be determined at lower shear rates. The shows the yield points of various solder pastes as a function of temperature.
A further solder paste characteristic is its so-called wet tackiness. The solder paste’s adhesive strength over a period of time ensures that components adhere to the printed paste not only immediately after assembly, but rather up through the soldering process as well. Wet tackiness counteracts component uplift due to the buoyancy force resulting from the flow of air or nitrogen.
In the Y direction
Buoyancy force in the Y direction at 100% fan power is 34.5 µN and is thus smaller than the weight force of the component which amounts to 44 µN. Taking the additional wet tackiness of the solder paste into account, the component cannot be displaced in this direction by the wind forces.
In the Z direction
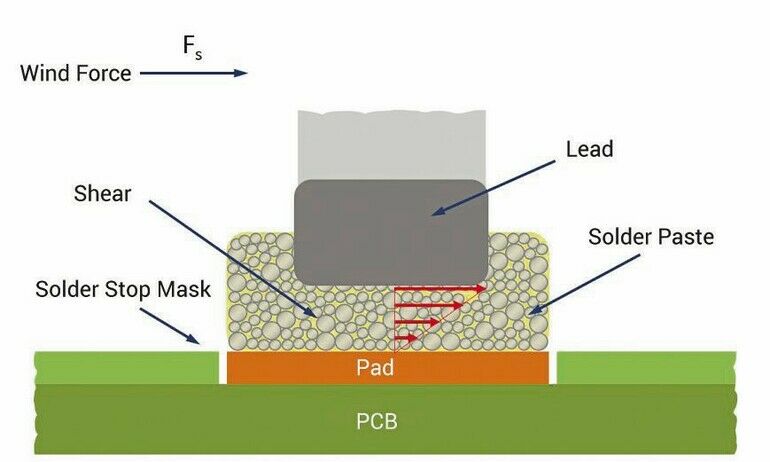
As described in ‘Experimental Investigations’, blown off components (at 91% fan power and 180° C) in proximity to the pads exhibit failure due to shear stress. The diagram overleaf offers a schematic representation of shear stress on the solder paste layer as a result of lateral wind force.
The fact that the shear stress on the solder paste does not occur abruptly, but gradually, must also be taken into account. The component moves into the flow of air at 16.7 mm/s, and blowing force increases as it gets closer to a nozzle. When this force exceeds the solder’s yield force, the component moves.
Yield force FF with cross-sectional surface area A amounting to 1.35 x 10⁻⁷ m², which is equivalent to the contact surface of a lead, and a yield point σF of 273 N/m² at 23° C can be calculated with the
formula: FF=2AσF
and amounts to 73.7 µN. Blowing force in this direction is 71.3 µm and is smaller than the calculated yield force. It should also be noted that the solder paste is squeezed out around the lead after placement, increasing the effective surface area of the paste being sheared. If this arises, an area larger than just the connection area must be anticipated.
3. With solder paste at 91% fan power and 180° C
Component blow-off was observed at 180° C with 91% fan power. As shown in the graph on page 41, the yield point of the solder paste decreases as a function of temperature. In zone 2, in which the knocked over components were discovered, the PCB had a temperature of 67° C. No results for the yield point of the solder paste are available for this temperature. For this reason, the yield point for solder paste 3 is extrapolated from the graph based on the assumption of a linear characteristic curve. The yield point is 162 N/m² and the resulting yield force is 43.74 µN. This is smaller than the simulated force of 65 µN, and the component is blown off. Considerable deviation of these forces can be attributed to the lack of yield point data at higher temperatures.
Summary
The investigation results presented here show that the SOD323 can be reliably processed by selecting appropriate solder and using the right oven settings. The default setting, i.e. 73% fan power, provides a sufficient safety margin relative to determined limit loads at 91% fan power. For some PCBs, for example with very large coils or pin-in-paste technology, frequencies and thus fan power as well must be increased in order to intensify heat transfer into the PCB. It’s advisable to check these PCBs for the presence of flow-sensitive SOD323s and, if necessary, to run a test with an assembled PCB if the frequencies need to be increased.
If fluctuations occur for other parameters like connection surface tolerances or solder paste properties, different relationships must be reckoned with. For example, the tolerance-related reduction of the connection surface area to 0.25 x 0.3 mm, instead of the typical 0.3 x 0.45 mm, causes a yield force reduction to 40.9 µN. As a result, the component can no longer withstand the ascertained blowing force of 71.3 µN.
Productronica, Booth A4.335
Check out part one
The first part of this white paper was published in our April 2023 issue, and described how the investigation on the influence of flow temperature on SOD323s being blown away was set up and conducted.
About Rehm
Rehm Thermal Systems is a specialist in the area of thermal system solutions for the electronics and photovoltaic industries and is among the leaders in technology and innovation in the modern, cost-effective production of electronic assemblies. As a global manufacturer of reflow soldering systems with convection, condensation or a vacuum, drying and coating systems, functional testing systems, equipment for metallisation of solar cells and numerous customised special systems, we have a presence in all the relevant growth markets and, as a partner with over 30 years of industry experience, we arrive at innovative production solutions that set new standards.


