Manufacturers of electronic devices and components must guarantee a high quality level, this could require documentation for each bonded wire. How can a “zero defect” requirement of each bond be guaranteed, what can be carried out during the bond process or after successful bonding for quality control without damage or destruction to the wire?
A series of technology for controlling bond quality has been developed to gain characteristics with which a bond can be classed as “good” or not. We differentiate between:
- Offline method (optical inspection, mechanical test, destructive and non-destructive)
- Inline method (mechanical, non-destructive test)
- Online method (process integrated method)
With the offline and inline methods, quality values are measured or calculated once the bond process is complete. These methods refer to a statistical process model, the test results are random.
The inline method is generally non-destructive and the test apparatus is integrated into the machine. The test requires no operator intervention. For quality assessment of a wire, the process values measured during the bonding process are not drawn upon in either the inline method or the offline method. Furthermore, these methods bear the risk of damaging or weakening the bonds, without this showing up in the test.
In comparison, online methods offer decisive advantages. They are carried out in real time, therefore controlling the process as it happens. Without additional time consumption, all wires can be controlled (100% control). As only limited sensors were available, in previous processes only the current flowing through the transducer (ultrasonic generator works as the voltage generator) or the gradient current (ultrasonic generator works as current generator) as well as the deformation of the wire dependant on time measured by a deformation sensor were observed. Derived values e.g. impedance could be calculated from the set values and the measured values.
PiQC, multi-dimensional signal analysis of bond quality
Input signals of the process described here origin from different sources: the frequency, the phase difference between voltage and current and the ultrasonic current are detected directly from the ultrasonic generator. The wire deformation comes from the bondhead kinematics. The mechanical ultrasonic oscillation and the phase angle between the wedge oscillation and the ultrasonic current measured by the additional sensor in the bondhead. Further process relevant values are derived from these signals, such as the friction between wedge tip and wire, the friction between wire and substrate, the coupling of the wire to the substrate, the wedge tip displacement/velocity and many more. Further values based on comparison functions work as input values for the calculation of the quality index.
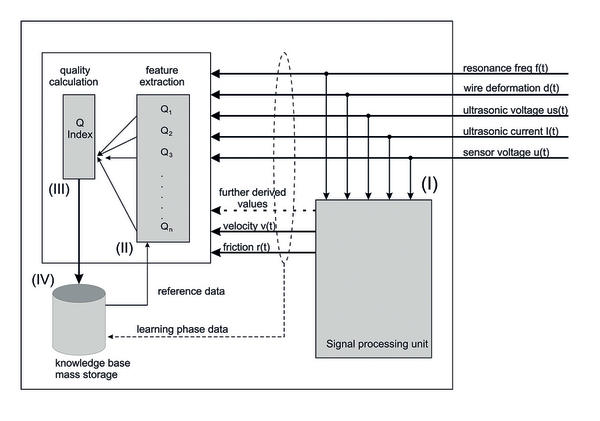
Figure 1 provides a systematic overview of the components necessary for the calculation of the quality indices and their arrangement. The raw sensor signal taken during welding and the feedback data from the ultrasonic generator are fed into a signal processing unit (I), which calculates additional derived signals such as friction and wedge tip velocity. Together with the already mentioned values for current and impedance, wire deformation etc. and the resonance frequency measured in real-time, each of these values serve as the input for a feature extraction system (II) which then calculates a so called quality index Qi for each signal. A total quality index Qt for the bond is calculated from the individual indices, under consideration of emphasis, in a signal processing unit (III) (quality evaluation). This total quality index is then saved (IV). Optimized reference data have to be recorded for the evaluation of input data for every application.
Assuming the existence of a stable bond process resulting in sufficiently high bond quality, reference data is generated in automatic mode for all directly measured or derived values which forms the basis for the calculation of quality indices. Instead of recording a fixed reference graph for different processes, the graphs are generated dynamically by the system itself. A model of the bond formation suitable for judging bond quality is created from measured values.
Experiments for evaluation of the system were carried out for heavy wire and fine wire applications. Now, the system is in use in large-scale productions of the automobile parts suppliers industry and in several medium- and small sized companies.
PiQC analyses of wire bonding production Issues
Contamination by Plastic Particles: In many applications, the bond material is enclosed in a plastic housing, which travels automatically through several process machines were it is loaded, clamped and ejected. This mechanical stress can cause debris which may deposit on the bond surfaces. This problem was analyzed on behalf of an automotive manufacturer. The debris particles were purposefully placed on the bond sites before bonding. All contamination was detected by the PiQC system.
In this experiment, the measured total quality indices Qtot of the bond wires contaminated with plastic particles displayed values between 0.85 for very small particles and 0.05 for larger particles. The threshold value for Qtot is typically set below 0.85 which would render those bonds contaminated with very small plastic particles unsuspicious. If one particular feature of the feature extraction is known to respond especially sensitively to the expected contamination, this feature can be given a higher emphasis for the calculation for the total quality index.
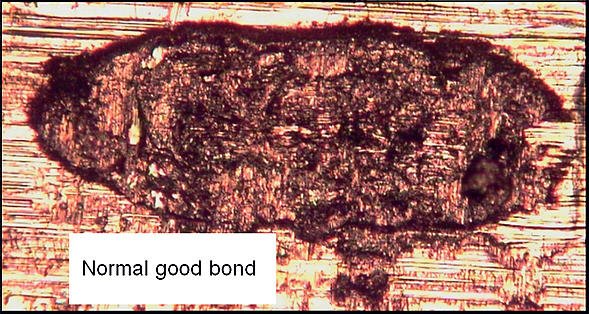
In Figure 2 (Qtot=0,09) it can be seen that after shear testing the welding surface underneath the enclosed plastic particle still appears in its original condition, which means that an inter-metallic connection between the wire and the substrate has not occurred. This wire holds a shear force of 1277 cN. The average value for the other bonds was 1370 cN with a standard deviation of 77 cN. Standard methods for quality control would have failed to detect this bond as insufficient. The contamination would not have been detected.
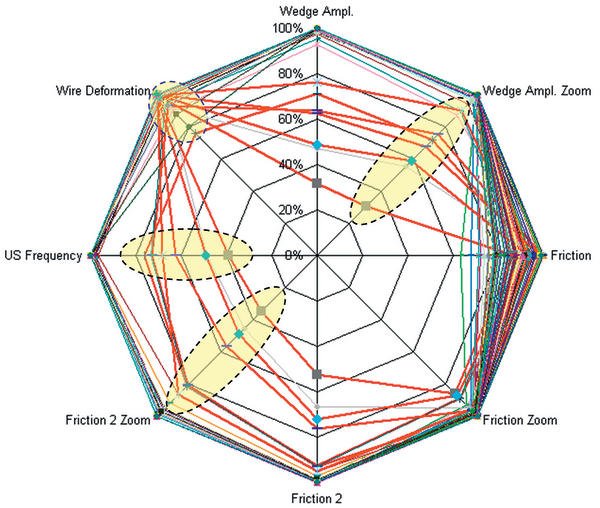
Some of the output values of the feature extraction are displayed in figure 3 in the form of a radar chart. It is notable that the wire deformation feature is highly insensitive to this form of contamination. The characteristics of friction show an equally weak response. The frequency and wedge amplitude are the strongest indicators in this case.
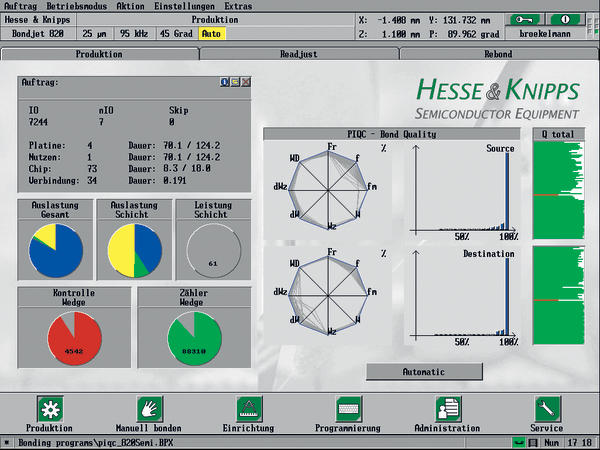
Contamination with finger grease in fine wire bonding: A further example is the effect on bond quality of bond surfaces contaminated with finger grease. A significant fall in the quality values can be seen (figure 4). The effect of contamination is clearly recognizable here. The frequency progression, the derivation of the wedge oscillation and the friction are especially responsive in this case. The wire deformation and the wedge amplitude do not react to this failure mode.
Bonding on lead edges: A further indicator for the sensitivity of the system, wires were bonded on lead edges. The bonds were places nearer than 25 µm to the edge of the bond surface, the bond feet are still completed on the bond surface. Nevertheless, the quality values for these bonds fall significantly. As opposed to the contaminated bonds described initially, a different distribution of the affected features in the radar chart can be seen. The mean bond frequency and the wedge amplitude are the most characteristic values in this case. All other signals are insensitive to this type of failure.
Summary
None of the parameters used have shown the same sensitivity to all of the evaluated failure types. The output values of the feature extraction have instead shown a different distribution in the field of results for different failure types, i.e. different combinations of individual quality indices were found for each of the cases.
EPP Europe 425
Share:


