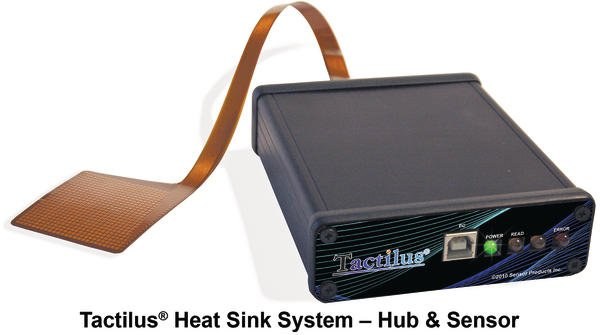
- Creates pressure vs. time graphs and histograms
- Performs 2D, 3D and 360 degree image rendering and region of interest scaling
- Displays maximum, minimum, and average pressures and does force integrations and
- Prepares reports through export to Excel, ASCII, or Access formats.