Leading semiconductor test equipment supplier Advantest Corporation (TSE: 6857) has introduced a new 3D image viewer, the Euclid, for its Hadatomo series of photoacoustic microscopes. The Euclid can display 3D images by superimposing data on melanin in the skin, the vascular network, and the skin structure, as measured by a Hadatomo tool, and can also easily create tomographic images. In addition, image display conditions can be imported as a configuration file, enabling easy comparisons of measurement data. The user-friendly 3D image viewer is an ideal tool for dermatological research in the fields of beauty and healthcare.
The Euclid 3D image viewer can be downloaded for free from the URL below. Even users who do not own a Hadatomo™ unit can experience its excellent performance using sample data. Advantest also welcomes consultations about reading image data measured by other devices.
Download the Euclid 3D image viewer here.
Product Features
• 3D Image Display
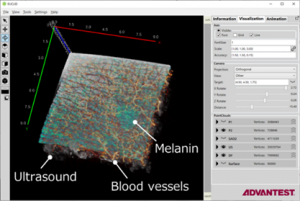
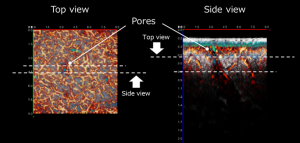
The Euclid 3D image viewer can display measurement data acquired by the Hadatomo™ series three-dimensionally. Images can be rotated and displayed from any angle. Users can also easily switch to a top or side view.
• Superimpose 2+ Types of Image Data
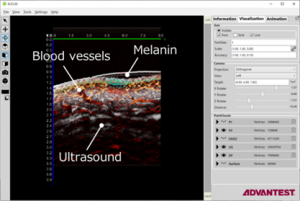
Users can freely combine and display skin structure data related to melanin, the vascular network, and ultrasound imagery.
• Create Tomographic Images of Regions of Interest
Images can be clipped horizontally or tomographically to isolate any region of interest on the XYZ axes of the superimposed images.
• Diverse Image Display Options
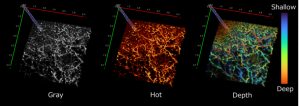
In addition to black and white images, you can also select any color map and display color images. The Euclid viewer also has a coloring function which can assign colors according to depth and oxygen saturation.
• Compare Data Under the Same Display Conditions
Users can save settings, such as image quality information including color map settings and brightness, and 3D display conditions, to configuration files. Import these configuration files to easily display and compare multiple datasets under the same conditions.