IC packages and other components can be imaged non-destructive-ly by acoustic micro imaging, which displays internal features. This technology has several operating modes which produce different types of images. Use of more than one image mode often gives additional information about a defect, and helps to analyze the cause of it.
Tom Adams, for Sonoscan, Elk Grove Village, IL, USA
The ‚ordinary‘ acoustic image is the planar image, looking down into the sample from above. This is commonly known as the C-mode image. The scanning ultrasonic transducer is coupled to the sample by a fluid, and alternates thousands of times per second between pulsing very-high-frequency ultrasound into the sample and receiving the return echoes.
The frequencies used in acoustic micro imaging range from 10 to 300MHz. Ultrasound of all frequencies always travels through a given material at the same speed, but different materials have different acoustic velocities. One example: the velocity in the epoxy used for encapsulation is often around 3,000m per second. Since the distance from the transducer to the interior of the IC package is usually measured in millimeters, the time needed for pulse and echo may be microsecond or less.
Despite this high speed, return echoes from different depths within the sample arrive back at the transducer at different times. An engineer or failure analyst making a planar image does not typically use echoes from all depths. Instead, he will electronically gate the return echoes on a depth of interest, which may be the die surface, the leadframe or some other depth.
Within the sample, no ultrasound is reflected from completely homogeneous materials. Ultrasound is reflected from well-bonded interfaces, where there is a difference in the acoustic impedance (density times acoustic velocity) of the two materials. It is reflected even more strongly from gap defects such as delaminations, disbonds, cracks and voids, all of which reflect virtually 100% of pulsed ultrasound.
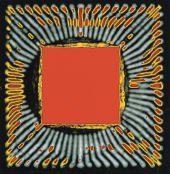
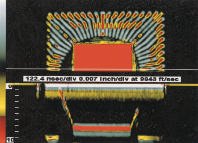
Figure 1 is the planar image of a plastic-leaded chip carrier (PLCC), a package type that is somewhat dated but useful for showing multiple imaging modes. This PLCC has experienced a popcorn crack. Named for the noise made when it forms, a popcorn crack usually occurs during solder reflow when excess moisture in the molding compound is heated rapidly. In figure 1, the PLCC has been imaged acoustically at a frequency of 15MHz from the backside of the package. Electronic gating uses only the echoes from the depth of the die paddle and leadframe to create this image. Other depths, both above and below the die paddle, are excluded. The popcorn crack is the more or less circular black region surrounding the die paddle. The die paddle appears red because it has been delaminated from the epoxy. In addition, there are numerous small delamin-ations (also red) along many of the leadfingers.
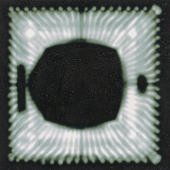
Figure 2 shows the same sample, imaged in the planar mode at the same frequency. The only difference is that the gating of the return echoes has been changed: gating here includes only the bulk of the backside-molding compound. That is, most of the thickness of the molding compound between the die paddle and the backside surface of the package, but excluding both die paddle and package surface. As often happens, this popcorn crack has propagated toward the back surface of the package, and is visible as an incomplete white circle around the die paddle. Even though the popcorn crack is nearly vertical at this depth, it is a gap defect and reflects ultrasound very strongly. Note also that the bulk of the molding compound itself is not quite homogeneous in appearance – it contains numerous filler particles, each of which creates an acoustic interface with the epoxy.
Gating – the way to different layers
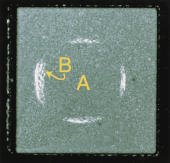
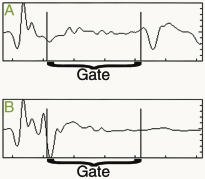
How does the user of an acoustic microscope know where to set the gate? He can position the transducer to send a pulse into a single spot on the sample, and examine the waveform of the return echo. Figure 3 shows the waveforms for the two locations marked A and B in figure 2. The two vertical lines mark the limits of the gate. The backside surface of the package is at the left of the wavform in figure 3.
The first waveform (3a) is from a location within the bulk-molding compound, away from the popcorn crack. The waveform represents, in its vertical axis, the level of the signals received at the transducer, and in its horizontal axis, the time of travel, which corresponds to the depth into the package. There is always a large echo from the top surface of the sample, represented here by the large spike just to the left of the gate. Within the gate itself, however, there are only small variations in the waveform, probably caused by inhomogeneous agglomerations of filler particles in the molding compound, or by very small voids. Out of sight just to the right of the gate is another echo that corresponds to the interface between the die paddle and the molding compound. (In figure 1 the entire gate is moved to the right and includes this interface.)
The second waveform (3b) is from a location directly over the popcorn crack within the molding compound. The surface echo (to the left of the gate) is similar to that in 3a, but the crack causes a large spike within the gate. Note that the crack blocks the ultrasound from proceeding any deeper.
Compound analysis using different images
Acoustic micro imaging can also makea non-destructive cross-section througha feature such as the popcorn crack(figure 4). A planar image is made first, and a line is described across the planar image to show where the vertical ‚cut‘ isto be made. The transducer then auto-matically scans this line at increasing depths, and produces the cross-sectional view shown in the lower half of figure 4. This mode is commonly known asQ-BAM (quantitative B-scan analysis mode). Since the acoustic velocity of the materials is known, the scale markers at the sides of the cross-sectional image can be used to measure the depth of a given feature. Here it can be seen that the left portion of the popcorn crack reaches the surface of the package, while the right portion reaches only about halfway to the surface. The width of the left portion of the crack in the cross-sectional image is the same as its width along the line in the planar or C-mode image. At the lower left of the cross-sectional image is the profile of one of the small lead finger delaminations; the line marks the same delamination in the planar image. The delamina-tion (red) of the die paddle from the molding compound is also shown in profile.
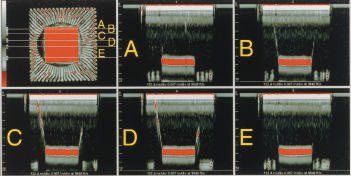
A novel technique, recently developed by Sonoscan, permits making many non-destructive cross-sections at the same time. Multiple lines are drawn in the planar image, and the transducer automatically produces multiple views. The results are shown in figure 5. The five views selected here follow the profile of the popcorn crack across the package. In the first frame (A), the crack is only faintly apparent to the left of the die paddle. The second and third frames (B, C) show the crack growing in extent; in frame five (E), the crack has largely vanished. The various lines also mark the profile of several of the lead finger delaminations. Making multiple simultaneous cross-sections provides a comprehensive view of the extent and configuration of a complex internal feature such as this popcorn crack. If the sample is going to be physically sectioned after acoustic imaging, the multiple cross-sections show exactly where to cut and what results to expect.
A very different imaging mode is shown in figure 6. In this mode, called thru-scan, a second receive-only transducer is placed beneath the sample. Ultrasound is pulsed by the top transducer and received by the bottom sensor; the result is a focused acoustic shadowgraph of the entire thickness of the sample. Gap-type defects such as the popcorn crack reflect ultrasound and thus prevent it from reaching the second transducer. In this thru-scan im-age of the PLCC, the popcorn crack is visible as a dark circle around the die paddle. Also, some of the larger groups of lead finger delaminations create dark shadows. This technique very quickly tells whether a gap defects exists at any depth within the sample. It can also be used simultaneously with planar imaging. This combination is an especially effective way of identifying and analyzing internal defects with a minimum of time and effort.
Zusammenfassung
Ein anspruchsvolles Kapitel der Prüftechnik ist die zerstörungsfreie Untersuchung von IC-Gehäusen. Packages werden laufend kleiner, dabei komplexer und auch deren Strukturen sind Objekte großer Miniaturisierungsbemühungen. Um so wichtiger ist, wie im Falle von akustischem Mikro-Imaging, daß mit einer zuverlässigen Methode auch unterschiedliche Lagen/Ebenen von Packages zerstörungsfrei auf Fehlermechanismen wie Delamination des Dies vom Substrat analysiert werden können.
Résumé
Le contrôle non destructif des boîtiers de CI est une tâche exigeante de la technique de contrôle. La taille des boîtiers diminue sans cesse, leur complexité croît et leurs structures font également l’objet de gros efforts de miniaturisation. Il est donc d’autant plus important d’analyser de manière non destructive les différentes couches/épaisseurs des boîtiers à la recherche des mécanismes de défauts des boîtiers, comme la délamination entre le die et le substrat, avec une méthode fiable, comme c’est le cas de la micro-imagerie.
Sommario
Un capitolo della tecnica di controllo dal notevole carattere è rappresentato dal controllo non distruttivo di alloggiamenti IC. I Packages diventano sempre più minuti, allo stesso tempo più complessi mentre anche le loro strutture sono oggetti dall’altissimo grado di miniaturizzazione. Si rende dunque ancora più importante, come nel caso del Micro-Imaging sonoro, che mediante un metodo affidabile possano essere analizzati in maniera non distruttiva anche differenti strati/livelli di packaging al fine di rilevare la presenza di eventuali meccanismi difettosi, quali la delaminazione del Die dal sostrato.
Share:


