Board assemblers have invested heavily in technology to detect and repair manufacturing defects. Modern equipment can discover these failures earlier and measure the variance in the process. We explore the use of such inspection systems and the statistical foundations that is their operational basis.
John Arena, Dan Walsh, Teradyne Inc.
Vast sums of money and people are engaged in test and inspection, verifying boards for the purpose of eliminating the ‚random‘ assembly defects. Various forms of test equipment, in-circuit and function-al systems have been created largely to counter the systematic creation of defects in PCB assembly. Supporting this array of test equipment are repair stations serving the dual role of tracking rework and providing feedback on the process.
Where do assembly defects come from? Why do some assembled boards emerge from the line functioning, while others are manufactured with multiple defects? How does the process fail and what happens when it does? Why do measurements of assembly quality vary from batch to batch? What can be learned from these variations, and what can be done to remedy the variations in assembly? Where then do these defects come from? And can their creation be minimized?
These questions are the origin of 6-sigma manufacturing; a methodology using statistics to quantify variation and the effect on failure creation, to give a more deterministic endproduct quality while providing the opportunity for monitoring and improvement. The general manufacturing term, process control, is often used for the concept of process understanding qualification and control. Where 6-sigma differs is in the characterization of process variation, and the rigid application of measurement and test margins to verify that’normal‘ process variations do not generate errors in the assembly process.
Isn’t ‚good enough‘ good enough?
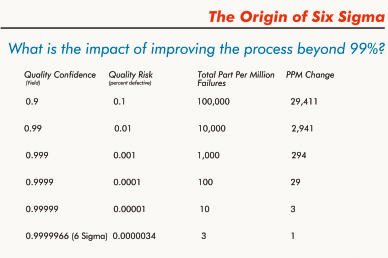
What is ‚good enough‘? How many mistakes per hour are acceptable? When does a process improvement effort succeed and improvement stop? First, let’s examine the effect of what common yardsticks for quality and effectivity mean to us in our ordinary world. Suppose we applied a ‚99%‘ rule to any industry, that is, we arbitrarily said, in the normal assemb-ly process, our subject industry would achieve a 99% good output. In the U.S., 99% ‚good‘ operation would translate to: 20,000 lost mail pie-ces per hour; 5,000 incorrect surgical operations per week, and 200,000 incorrect drug prescriptions each year. In reference to PCB assembly, 99% good would mean to 1999’s production: 5.4bn misplaced SMD capacitors; 4.3bn misplaced resistors; 675m misoriented ICs; and 39.6bn defective solder joints.
Therein lies the problem: How good enough is good enough? Is it 99%, 99.9% or 99.999%? Six-sigma manufacturing answers this problem not by setting a limit, but, rather, defining the problem in terms of the probability of the errors occurring as a result of normal process variation, and then instituting a methodology of determining acceptable limits appropriate based on statistical principles.
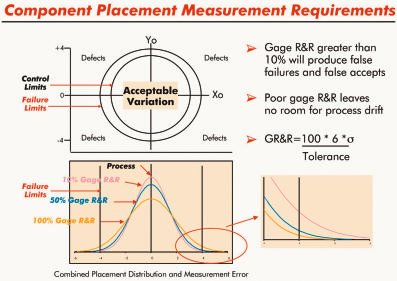
Six-sigma manufacturing recognizes that, in order to have controllable, deterministic product quality at the assembly level, its necessary to have both robust measurements of variability, and control of variability at the component and process levels. It defines the impact of improving the process quality of an activity to the point where failure limits are 6-sigma away from the mean sigma being the standard deviation of the population measurements of properties, be they values of components or placed position, etc. By 6-sigma we mean a process so in control that, even with proper test limits applied, the process can support some amount of normal drift in the mean without risking broach of a failure limit.
What 6-sigma means for board assembly
By variability, we mean any variance that would have a potentially negative effect on the product quality. We could easily construct a list of variables that would affect components on a PCB. To start with, we’d recognize that the design of a board (component tolerance buildup, pad/ land pattern de-signs) might be such that electrical or mechanical reliability was compromised i.e. by design, and we would be guaranteed a less than 100% yield even with perfect assembly techniques. Secondly, we’d recognize that variability in components and materials (size, quality, capability) themselves would impact the assembly. Thirdly, we would recognize that variations in the process could impact the assembly quality.
In PCB assembly, the enemy is variation. Once we’ve eliminated obvious sources of design, materials and assembly errors, what’s left are the variations created by the manufacturing process itself. Examining so-called attribute data, actual defects, makes it clear that unacceptable variation exists. Defects are commonly detected during in-circuit (ICT) or functional test (FBT), optical inspection or other means, at the end of the line when the assembly is complete. The nature and frequency of the attribute data point to sources of the variation. Attribute data represents hard, fixed defects that arise out of variation in the process. Attribute data is of the fail/pass or good/bad type.
Variable data is information that records some degree of variation in the process, but does not necessarily indicate a defect is also present. However, variable data is numerical measurement data that mustbe recorded and used later to correlate with attribute data and hard defects in order to differentiate acceptable variation from the variation that will result in adefect.
Finally, we need to recognize that some variation in the assembly process is inevitable and needs to be anticipated. The acceptable process variation (APV) is the result of assembly or acceptable mechanical variances in components and PCBs. APV yields variable data, but by definition is judged not to be the source of defects in the final product. If APV results in hard defects, there is a design or manufacturing problem that must first be remedied.
Unacceptable process variation (UPV) is variability that, when left unchecked, will lead to a hard defect, or to the material probability of a defect. A properly designed PCB and set-up process are designed to tolerate APV but detect and reject UPV. 6-sigma is used to define the methods and tolerances necessary to separate APV from UPV. To distinguish the variations and to be able to provide the continuous measurement, an understanding of the sources of variable and attribute data in board assembly is required.To implement measurement, mechanisms that can measure the variable and attribute data in real-time are required.
Attribute data is the focus of the many types of inspection and test equipment in manufacturing. Test floors are filled with AOI, ICT and FBT systems that screen for defects/quality and report back good and bad. The remaining problem is then, do we understand where the variables come from, how to measure the variable data, and how to correlate the attribute data after assembly (result) with the variable data collected during assembly?
Yield and defects per million (DPMO)
The first step is to understand the metrics that surround attribute and variable processes, and recognize the correlation. The yield is the measure of output as a percentage of input, i.e. what came in, what went out as pass, and what was the ratio of out versus in. It’s standard fare to utilize yield as the measure of performance for the assembly process.
At ICT and FBT stages two types of yield metrics are commonly used. The first pass yield (FPY) is the ratio of boards that pass at a test, as a percentage of the total. Two issues are raised: One, what does pass mean? For example, ICT cannot test bypass capacitors individually, nor can it examine for a variety of other defects. So, the coverage of an inspection or test program typically inflates the first pass yield needed to be interpreted appropriately. Two, what percentage of the process is completed at the stage where the verification is occurring? If a board goes through two test stages, between which additional assembly steps occur, then correlating the first pass yield needs to be done in context of coverage provided at each, and the incremental work done between both test stages.
For yield and DPMO considerations, a process engineer has his own yield measurement too. It’s called implied yield or process yield, and it’s computed based on the statistical probability of an error. Obviously, defects are inevitable in usual manufacturing. The measure of defect creation possibilities is measured in defects per million opportunities (DPMO). Industry benchmarks have concluded that the placement process generates errors on the order of 25 to 200DPMO, i.e.25 to 200 defects for every million parts placed.
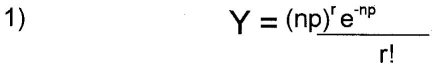
The process yield is computed using Poisson’s probability distribution, given as: (see formula 1) below )
Poisson’s applies where the probability of the defect is small, the sample large and the errors distributed. For example, for a board containing 300 solder joints, 100 components, and defect rates of 200DPMO for both solder and component stages, the process yield (where r = 0) is given by: (see formula 2) – 4) below)
The process yield is important to know, as it is a measure of the true capability. First pass yields are interesting performance metrics but represent only the yield for a particular board and are not an indicator of the process capability.
Sources of defects in the SMT assembly
While all variation can lead to defects, and all variation is the enemy in manufacturing, by convention we tend to talk about the composite process steps as the focal point of verification, not the individual actions that take place in the process itself. For example, plenty of users have validated the process capability of modern solder paste practice, chip placement method, etc. The performance at each of thesesteps is a composite of the capability of the equipment, the material used, temperature, maintenance schedule, the brand of paste and components, the variation in the size of the components between lots or vendors, etc. The point is, all variation can affect the outcome, but the degree to which any one input variable impacts the total process capability is not broken out separately.
We therefore tend to look at the major steps, paste, place and soldering. Where double-sided boards are assembled or subsequent steps occur, process metrics for these separate increments will also be reviewed. What has been reported is the rank order of defect creation by step isas follows: paste 25 to 50DMPO, place 100 to 200DPMO, through-hole 400DPMO, wave-soldering 150 to 200DPMO and reflow 2 to 5DPMO. The probability of a defect occurring is the product of rate (p) times the number of opportunities (n) using Poisson’s probability distribution. Hence, even while through-hole ranks highest (the technology is limited to 5% or less of modern boards), the total defects created place it 3rd overall.
How does optical inspection help?
Inspection at a line location has the potential of detecting the defects that have already been created, allowing to remedy and immediately correct the process. The benefits of inspection at each value-added step are leading to work-in-process (WIP) reduction, lowered cost of rework vs. deferral to later phases, and direct improvement of the yield measured at later test processes. But how do we measure variation that hasn’t yet created a hard defect, and how do we inspect for variations that, left unchecked, will create a defect?
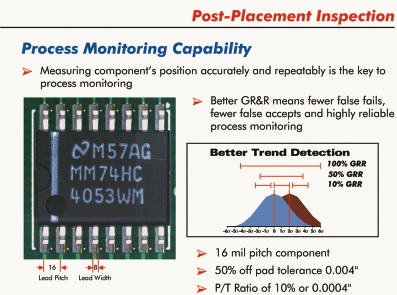
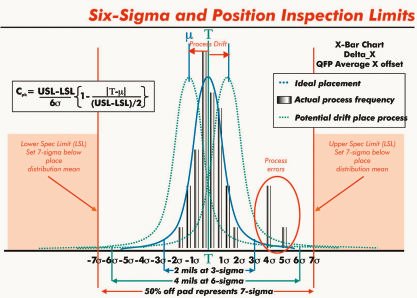
Modern AOI systems for component placement allow fine variations in X, Y and theta (rotational) displacement to be measured and tracked. These systems are smart enough to measure undesirable variation (position, size and registration) while tolerating acceptable process variation (component vendor changes, nominal size, markings or color), all while continuing to record the positional performance of the process.
Now, we’re able to distinguish the key variations in the placement process (position) separate from the irrelevant (i.e. acceptable, normal part change) variations. One issue remains: repeatability. Even though we may be able to distinguish key variations, we must also be able to do so repeatably enough to draw accurate conclusions about trending. The measurement of AOI itself must be repeatable such that variations in the process are distinguishable from the variations in the tool.
Engineers will recognize the more common form of this issue as the 10X-rule: that the instrument used should be at least 10-times better than the process that is verified. Herein lies the key issue: how repeatable is the system measuring the process? How do we evaluate AOI repeatability? The regular means of validating repeatability is the gauge repeatability and reproducibility measurement, gauge R&R, an assessment of a set of measurements made by a tool using a standard. By holding the standard constant, and using the tool over short and long time intervals, we can make an assessment of the tools‘ repeatability. It measures the repeatability of individual one-shot measurements. The one-shot gauge R&R must show a repeatability that is at least 10-times greater than the smallest feature or component displacement we are trying to measure.
Modern AOI systems are available that feature one-shot gauge R&Rs of better than ±0.4-mil (10mm) at 3-sigma confidence. This reference notes that the repeatability measurement itself is subject to statistical variation. The ±3-sigma qualifier means the manufacturer guarantees that >99.73% of the measurements made in a gauge R&R will fall within the specified limit. So, what should we require for a gauge R&R specification in AOI used for 6-sigma manufacturing?
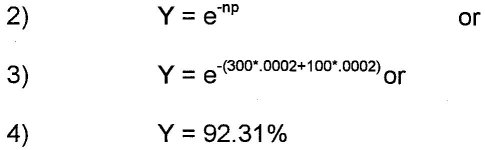
It’s commonly thought that the smallest feature in regular use today is an 0201-geometry discrete, with the requirement of measuring 50% off-pad performance which would represent 5-mil. Using the 10X-rule, the system would need a gauge R&R no greater than 0.5-mil at 3-sigma. But the smallest feature to be measured in normal production today is a 16-mil pitch QFP. The leads on a 16-mil part are 8-mil wide. 50% off-pad placement represents a 4-mil displacement. 10X against this displacement represents a need for 0.4-mil gauge R&R at 3-sigma, 20% better than even the 0201-discrete would require.
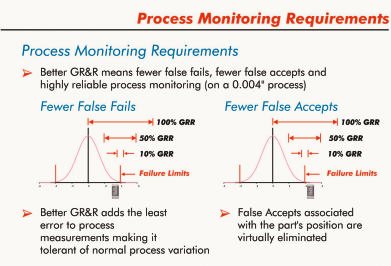
6-sigma manufacturing is a goal driven by understanding and managing variations. It means measuring and improving the process, requiring the equipment to identify real trends versus random variation. The purpose of linking the 6-sigma discussion with competent optical inspection is to provide a stable reference to validate the absence of gross assembly errors, and to provide the fine, repeatable positional measurements from component placement. To validate 6-sigma performance, AOI plays a key role. Advanced systems have the repeatability, performance and speed to keep up with even higher assembly requirements while providing the manufacturer with key metrics on assembly process, and linking inspection statistical results to the placement processes itself, providing closed-loop control.
Reference
The nature of six-sigma quality, Mikel J. Harry, Motorola Press 1997
Zusammenfassung
Die hochvolumige Elektronikfertigung erfolgt nach dem Prinzip der 6-Sigma-Methode, die damit die zulässige Abweichung von einem statistischen Mittelwert definiert (geringe Defektrate von maximal 3 ppm). Bei solch minimalen Fehlerquoten kommt der Überwachung und Steuerung der Prozeßqualität höchste Bedeutung zu. Ein probates Werkzeug, um 6-Sigma-Fertigung zu kontrollieren, ist die Anwendung sehr genauer (messender) optischer Inspektionssysteme.
Résumé
La fabrication électronique en masse se déroule suivant le principe de la méthode 6-Sigma, qui définit l’écart admissible par rapport à une moyenne statistique (taux de défauts faible de 3 ppm maximum). Avec des taux de défauts aussi réduits, la surveillance et la commande de la qualité du processus occupent une place majeure. Les systèmes d’inspection optiques très précis (effectuant des mesures) constituent un outil efficace pour le contrôle de la fabrication 6-Sigma.
Sommario
La produzione ad alto volume di componenti elettronici avviene secondo il principio 6-Sigma, in grado di definire lo scostamento massimo ammissibile da un valore medio statistico (un basso tasso di errori, al massimo 3 ppm). Con simili bassissimi tassi di errore, il sorvegliamento e il controllo della qualità di processo va a rivestire un ruolo importantissimo. Uno strumento affermato per il controllo di produzioni 6-Sigma è costituito dall’applicazione di sistemi ottici di ispezioni ad altissima precisione (con misurazione).
Share:


